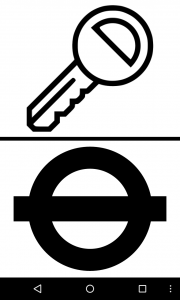
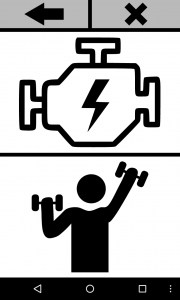
After running the project, the screen will display images or text for the user to make their way through the project. The project is set out like a decision tree or survey. Therefore, clicking on each image (or text box) will lead the user to the next ‘level’ of the decision tree, until they reach the end of the project. The choices the user selects will form the data that the project was designed to capture.
To learn in more detail about these choices within a project click here.
In the following video, we demonstrate what the Sapelli screen looks like when a user is clicking through the different categories. In this example the user chooses icons representing (1) Public transport, (2) Bus, (3) Take a photo, (4) GPS point, (5) Accept the record:
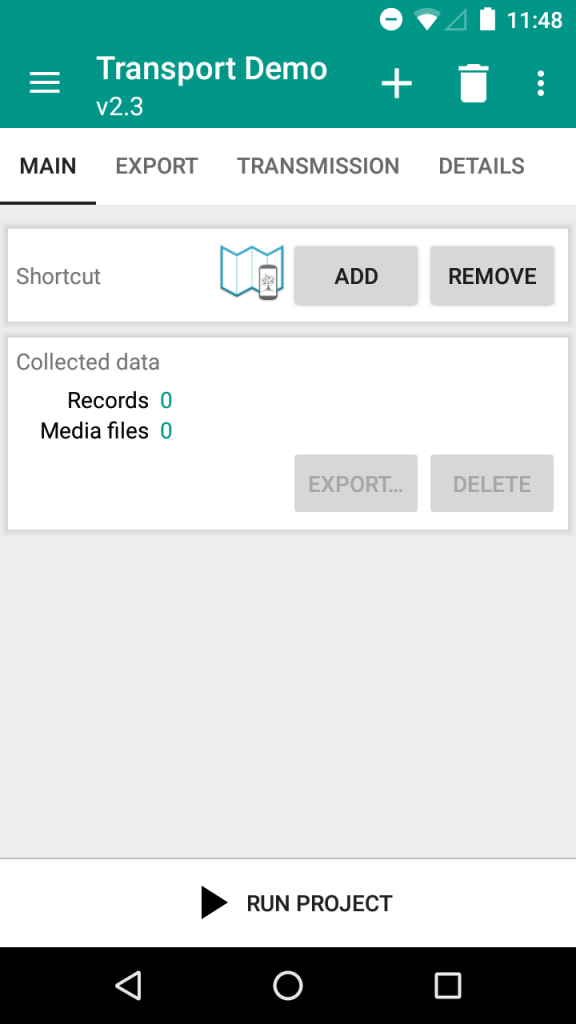
Finally, the user can see how much recorded data and media files they have collected under “Collected data” in the home page of the project.
To learn about how this data is then exported see Getting the collected data section of this tutorial.


