
This section of the tutorial will illustrate what the collected data will look like before describing the example data. You can explore the data in two formats, either as an XML or CSV file.
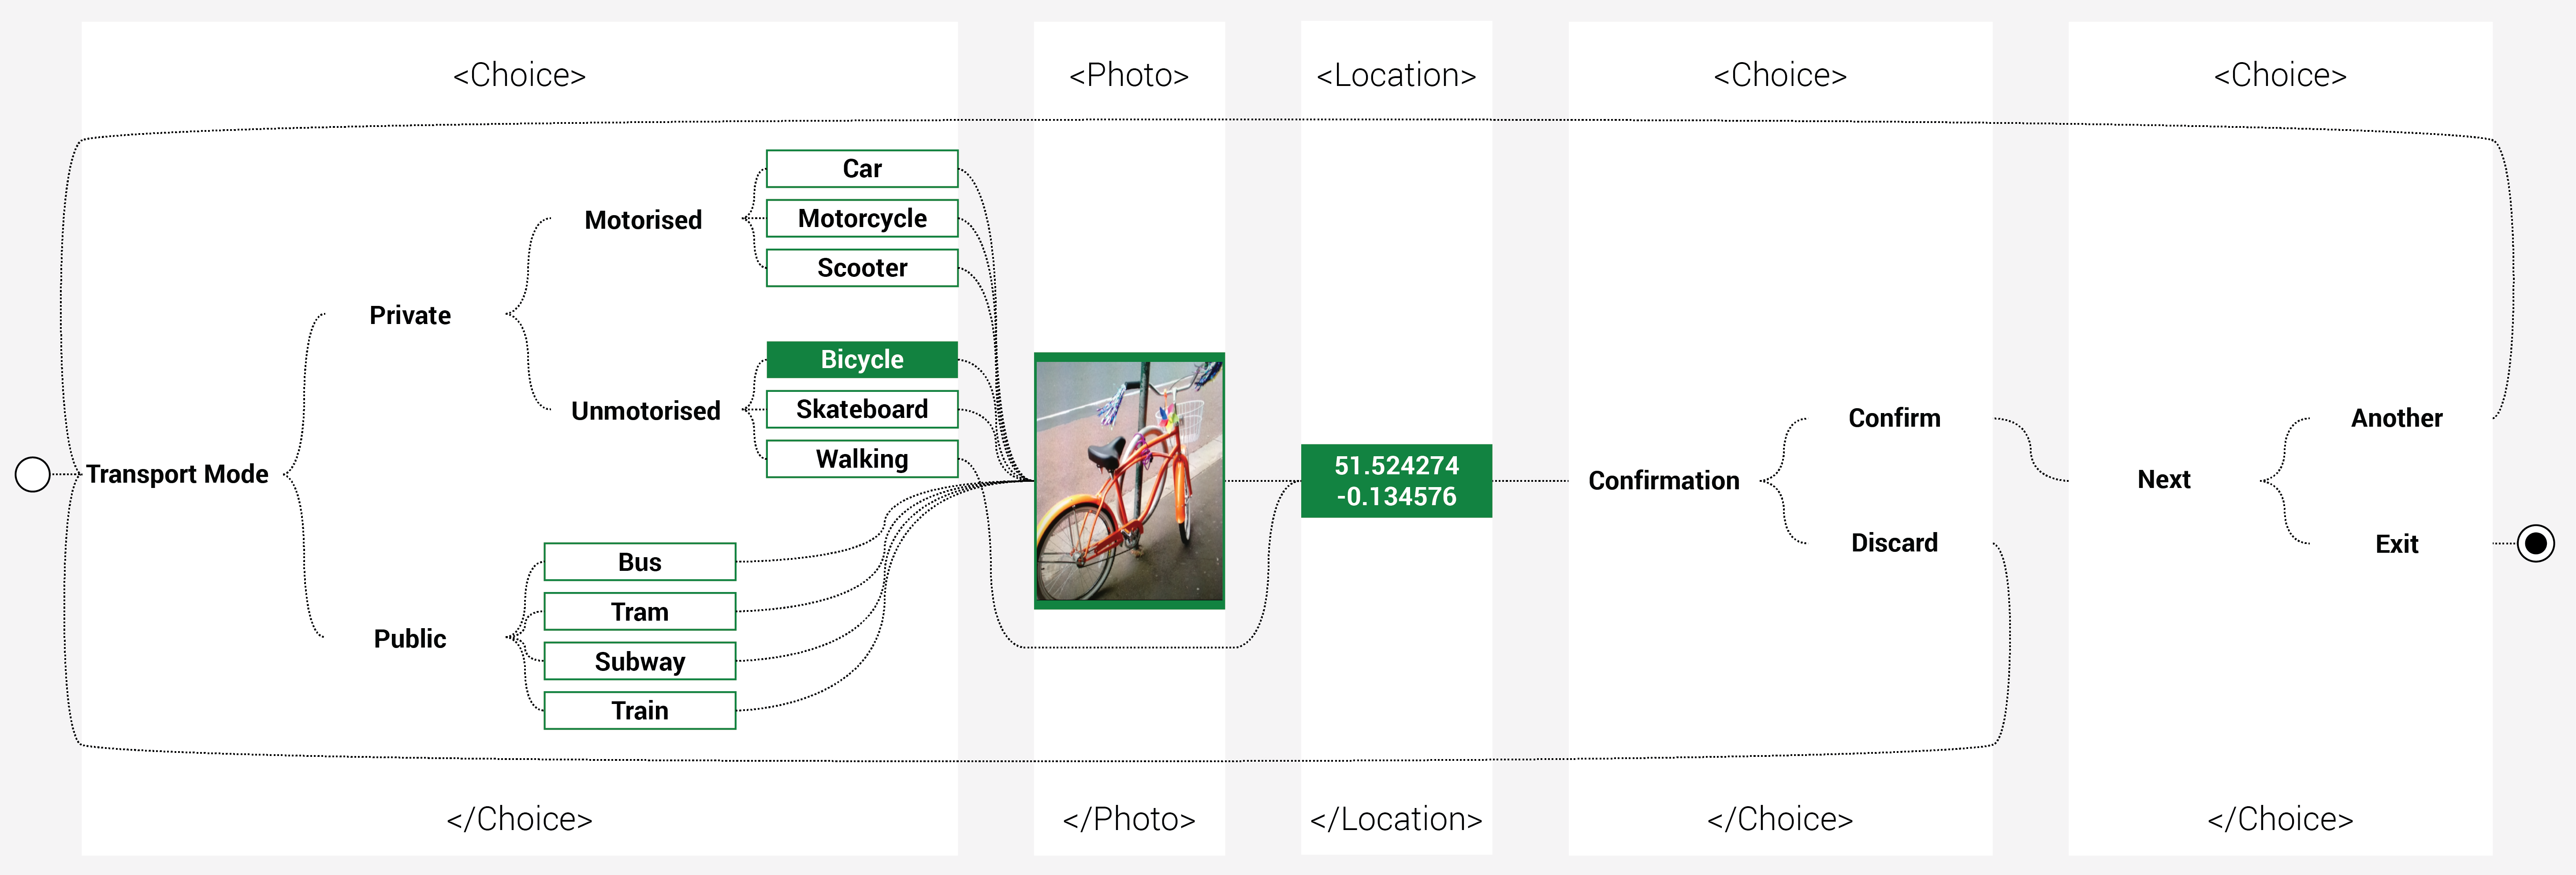
The image above illustrates what data is actually captured using the Transport Example. The fields with a green outline demonstrate the values that can be potentially recorded within this project. The fields highlighted in green show one specific case in which the user selected ‘Bicylce’ as a final choice, took a photo of their bicylce and recorded the location thereof. The black fields purely serve the purpose of navigation and do not actually store any values. This can be achieved with the noColumn=”TRUE” attribute.
When it comes to exploring the data, if you imagine an Excel spreadsheet, each data record will be displayed within a cell underneath the relevant column. The columns correspond to the Fields, the first one being the Choice field in this example. If you will be looking at the data using the XML format, rather than CSV, then the principle is the same but the data is displayed as rows of text as in an XML file rather than a table.